> ## Documentation Index
> Fetch the complete documentation index at: https://docs.cristalyse.com/llms.txt
> Use this file to discover all available pages before exploring further.
# Quick Start
> Create your first chart in 30 seconds
## Your First Chart in 30 Seconds
Let's create a beautiful scatter plot with just a few lines of code.
Add the import to your Dart file:
```dart theme={null}
import 'package:cristalyse/cristalyse.dart';
import 'package:flutter/material.dart';
```
Create a simple dataset:
```dart theme={null}
final data = [
{'x': 1, 'y': 2, 'category': 'A'},
{'x': 2, 'y': 3, 'category': 'B'},
{'x': 3, 'y': 1, 'category': 'A'},
{'x': 4, 'y': 4, 'category': 'C'},
];
```
Create the chart with grammar of graphics:
```dart theme={null}
CristalyseChart()
.data(data)
.mapping(x: 'x', y: 'y', color: 'category')
.geomPoint(
size: 8.0,
alpha: 0.8,
shape: PointShape.triangle,
borderWidth: 1.5,
)
.scaleXContinuous()
.scaleYContinuous()
.theme(ChartTheme.defaultTheme())
.build()
```
## Complete Example
Here's the full widget ready to use:
```dart theme={null}
import 'package:cristalyse/cristalyse.dart';
import 'package:flutter/material.dart';
class MyFirstChart extends StatelessWidget {
@override
Widget build(BuildContext context) {
final data = [
{'x': 1, 'y': 2, 'category': 'A'},
{'x': 2, 'y': 3, 'category': 'B'},
{'x': 3, 'y': 1, 'category': 'A'},
{'x': 4, 'y': 4, 'category': 'C'},
];
return Scaffold(
appBar: AppBar(title: Text('My First Chart')),
body: Padding(
padding: EdgeInsets.all(16.0),
child: CristalyseChart()
.data(data)
.mapping(x: 'x', y: 'y', color: 'category')
.geomPoint(
size: 8.0,
alpha: 0.8,
shape: PointShape.triangle,
borderWidth: 1.5,
)
.scaleXContinuous()
.scaleYContinuous()
.theme(ChartTheme.defaultTheme())
.legend() // ✨ Add a legend to show categories
.build(),
),
);
}
}
```
**Result:** A beautiful, animated scatter plot with color-coded categories!
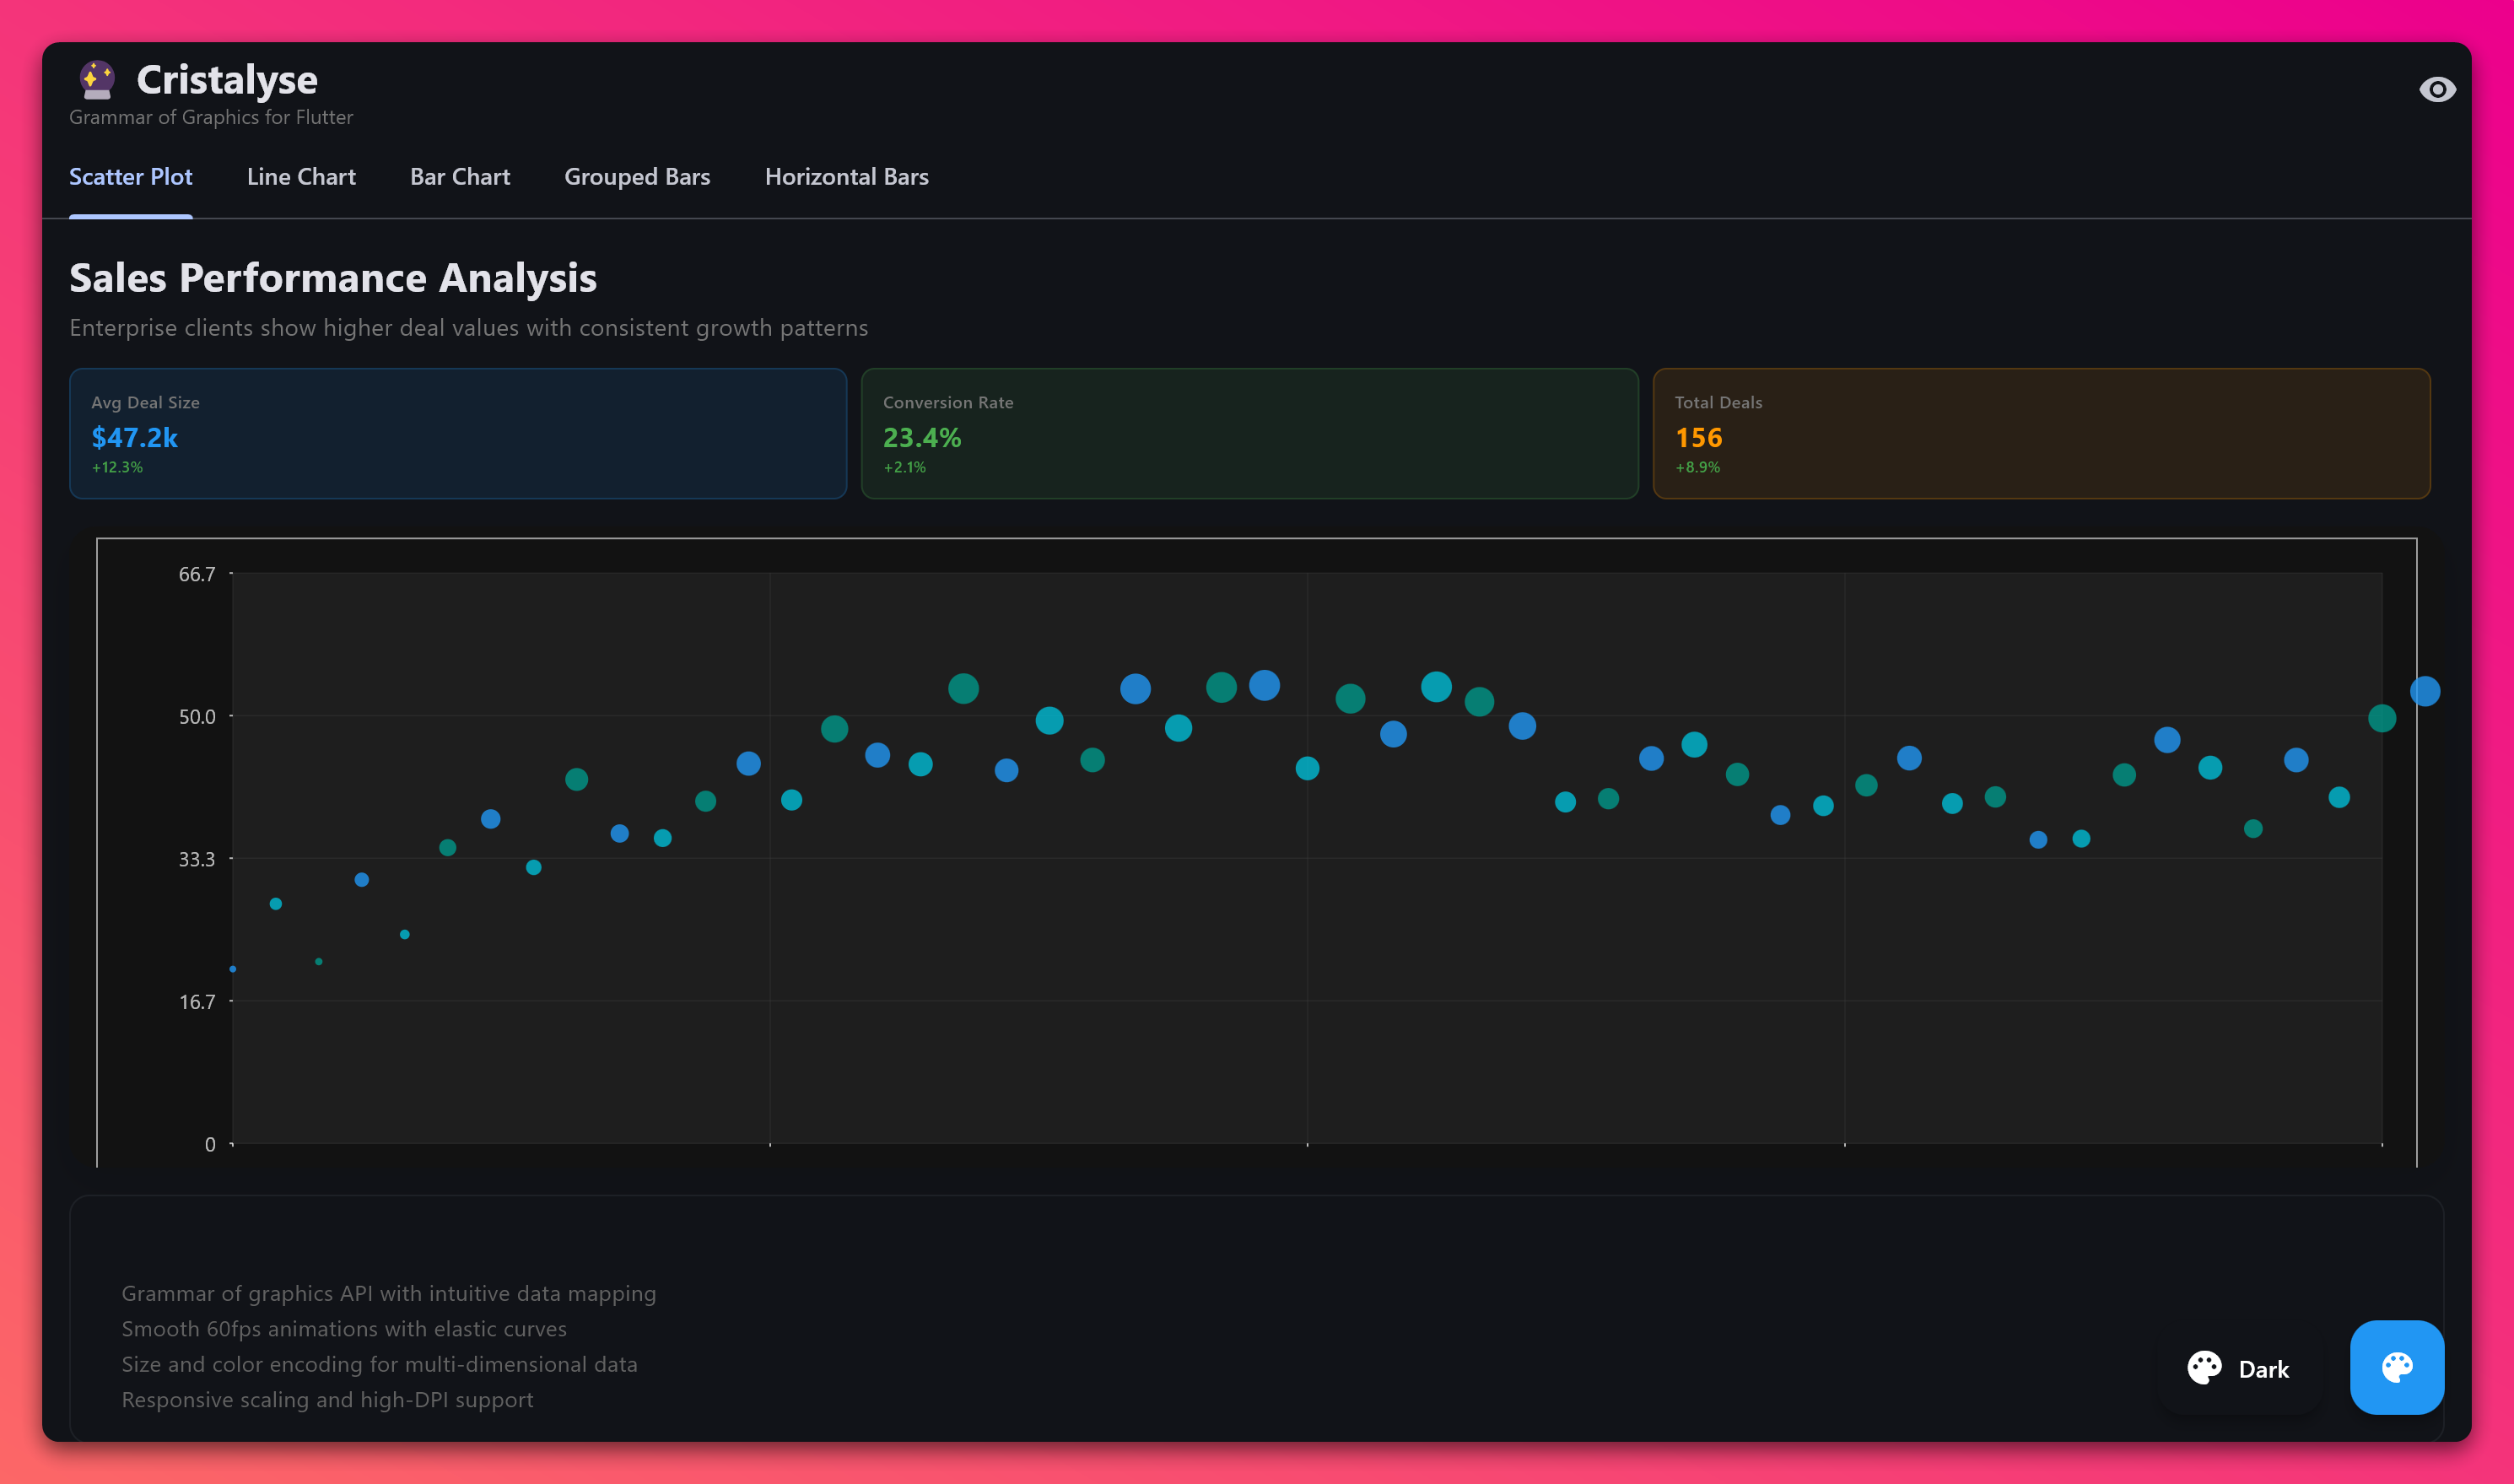 Your first chart - clean, responsive, and cross-platform
## Formatting Axis Labels
You'll often want formatted axis labels.
The `labels` parameter takes any function that converts a number to a string:
```dart theme={null}
CristalyseChart()
.data(salesData)
.mapping(x: 'quarter', y: 'revenue')
.geomBar()
.scaleYContinuous(labels: (value) => '\$${value}') // $150
.scaleXOrdinal()
.build()
```
For robust, locale-aware formatting, use NumberFormat:
```dart theme={null}
import 'package:intl/intl.dart';
CristalyseChart()
.data(salesData)
.mapping(x: 'quarter', y: 'revenue')
.geomBar()
.scaleYContinuous(labels: NumberFormat.simpleCurrency().format) // $1,234.56
.scaleXOrdinal()
.build()
```
## Adding a Legend
**New in v1.5.0**: Built-in legend support with zero configuration!
When your chart has color categories, add a professional legend with one line:
```dart theme={null}
final salesData = [
{'quarter': 'Q1', 'revenue': 1000, 'product': 'ProductA'},
{'quarter': 'Q2', 'revenue': 1200, 'product': 'ProductA'},
{'quarter': 'Q1', 'revenue': 800, 'product': 'ProductB'},
{'quarter': 'Q2', 'revenue': 950, 'product': 'ProductB'},
];
CristalyseChart()
.data(salesData)
.mapping(x: 'quarter', y: 'revenue', color: 'product') // Color mapping required
.geomBar(style: BarStyle.grouped)
.legend() // ✨ Automatically creates legend for each product
.build();
```
**Key Benefits:**
* **Zero Config**: Just add `.legend()` and it works
* **Smart Positioning**: Defaults to top-right, 8 position options available
* **Dark Mode Ready**: Text automatically adapts to theme colors
* **Auto-Symbols**: Squares for bars, circles for points, lines for line charts
**Requirement**: Legends need a `color` parameter in your `.mapping()` call to detect categories.
### Quick Legend Positioning
```dart theme={null}
// Bottom legend (great for mobile)
.legend(position: LegendPosition.bottom)
// Right side legend
.legend(position: LegendPosition.right)
// Top-left corner
.legend(position: LegendPosition.topLeft)
```
Learn more about [legend customization and styling](/features/legends).
## Understanding the Grammar
Cristalyse follows the **Grammar of Graphics** pattern:
`.data()` - Your dataset as a List of Map objects
`.mapping()` - Connect data columns to visual properties (x, y, color, size)
`.geomPoint()`, `.geomLine()`, `.geomBar()` - How to visualize the data
`.scaleXContinuous()`, `.scaleYContinuous()` - Transform data to screen coordinates
`.theme()` - Colors, fonts, and visual styling